
Entrepreneurial Factors: Financial
Investment capital can come from many sources including from the entrepreneur’s own savings, friends and family, Angel Investors, or private equity. Yet, we elected to focus on venture capital since this money is most closely associated with highly scalable ventures.
Five critical questions about funding were asked and Orange County was benchmarked against six entrepreneurial counties in the United States. In California, three of these counties were chosen because of their high levels of VC investment, they were: Santa Clara, Los Angeles, and San Diego. The two other counties from other regions of the US included in this study were Travis County in Texas and Middlesex County from Massachusetts because of their high level of entrepreneurial activity.
The majority of the data from this study was compiled from VentureXpert, the database of new ventures and VC firms maintained by Thompson Financial and fueled by the annual and quarterly surveys conducted by the National Venture Capital Association. VentureXpert, part of SDC Platinum, is regarded in the entrepreneurship literature as one of the most reliable sources of information about VC financing. The period we specified for our database search was quite extensive: the last thirty years (from 12/31/1979 through 12/31/2009).
Questions 1: How does OC compare to its peer group in terms of the number of ventures financed by VC firms in the last twenty years?
Answer: We summed the results in Table F1 to show that OC came in fifth place out of the six counties. Graphically, we showed the number of ventures financed by year in Figure F1. This graph depicts the environmental factor where many firms were being financed due to the economic times, especially during the dot com bubble. It is important to note that OC was more stable during the ebbs and flows of the economy; could this imply more rational choices by VCs in OC comparatively speaking?
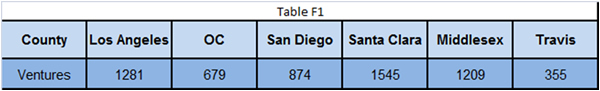
Figure F1
Questions 2: How many IPOs were launched as a result of VC funding?
Answer: In terms of success, the most successful ventures typically launch IPOs and thus become independent ventures financed by public markets rather than private investors. In Table 2 we see that OC came in fourth place out of six. This data was collected over a thirty year period and it’s important to note that OC was only 8 IPOs away from third place and 14 IPOs away from second place. Figure F2 shows that OC is correlated closely to five of the counties, with Santa Clara being an anomaly from 1991 to 2001 during the technology boom.
Figure F2
Questions 3: What was the amount of financing provided to new ventures?
Answer: Table F3 shows that OC came in fifth place out of the six counties. Graphically we can see in Figure F3 that OC followed many counties in a similar pattern according to the economic times.
Figure F3
Questions 4: How many VC firms were in OC and its peer group?
Answer: Table F4 shows that OC came in fifth place out of six. Perhaps another question be how does OC compare to the peer group when we juxtapose Table 3 to Table 4 to see how much money was invested per VC firm? Or perhaps juxtaposing Table F1 to Table 4 to see how much money was under capital per firm financed?
About Venture Capital in OC: What our research told us is that the VCs tend to overlook Orange County. Why? On theory is the abundance of family owned firms which tend not to exit via the capital markets.